Easy Custom Reports with Card Components
Default Cards are useful during development when you need to quickly inspect artifacts produced by a task or visualize the overall structure of the flow. As your project progresses, you may want to create a custom card that highlights information specific to your project.
The easiest way to create a custom card is to use built-in components: Images, Tables, Artifacts, VegaChart charts, Markdown text, and ProgressBar for tracking progress. You can construct a report with these components in Python without having to worry about HTML or styling in CSS. Rest assured that if components ever show their limits, you have an option to customize reports even further using Card Templates.
Let’s start with a simple example:
from metaflow import FlowSpec, step, card, Parameter, current
from metaflow.cards import Markdown

class GuessCardFlow(FlowSpec):

    number = Parameter('number', default=3)

    @card(type='blank')
    @step
    def start(self):
        current.card.append(Markdown("# Guess my number"))
        if self.number > 5:
            current.card.append(Markdown("My number is **smaller** ⬇️"))
        elif self.number < 5:
            current.card.append(Markdown("My number is **larger** ⬆️"))
        else:
            current.card.append(Markdown("## Correct! 🎉"))
        self.next(self.end)

    @step
    def end(self):
        pass

if __name__ == "__main__":
    GuessCardFlow()
Notice how in the @card decorator we specify type=’blank’. Instead of the Default
Card, we want an empty card with no content by default. The blank card provides a
nice empty canvas for custom components.
The current.card.append call adds a component in the card. Each component occupies a
row in the card, so you don’t have to worry about the layout. If you run
GuessCardFlow, you will see a card like below. The exact content depends on the value
of the number parameter.

Currently, the following components are provided:
Markdown- output a block of text formatted as Markdown.Table- a table of rows and columns. Each cell may include other components.Image- an image, constructed from bytes.Artifact- pretty-print any Python object.VegaChart- plot charts with Vega Lite.ProgressBar- show progress.
The API reference documents the card components in detail.
The following example demonstrates the first four components in action (more
about VegaChart below and ProgressBar in the next chapter):
from metaflow import FlowSpec, step, current, card
from metaflow.cards import Markdown, Artifact, Image, Table
import requests

ROOT = 'https://upload.wikimedia.org/wikipedia/commons/'
IMAGES = {
    'Mammals': {
        'cat': 'b/b9/CyprusShorthair.jpg',
        'bandicoot': '8/8b/Perameles_gunni.jpg',
        'dog': '5/5d/Akbash_Dog_male_2016.jpg'
    },
    'Birds': {
        'penguin': 'b/bf/Spheniscus_humboldti_20070116.jpg'
    }
}

class ComponentDemoFlow(FlowSpec):

    @card(type='blank')
    @step
    def start(self):
        for section, animals in IMAGES.items():
            current.card.append(Markdown('## %s' % section))
            rows = []
            for label, url in animals.items():
                resp = requests.get(ROOT + url,
                                    headers={'user-agent': 'metaflow-example'})
                rows.append([Markdown('Animal: **%s**' % label),
                             Artifact(resp.headers),
                             Image(resp.content)])
            current.card.append(Table(rows))
        self.next(self.end)

    @step
    def end(self):
       pass

if __name__ == '__main__':
    ComponentDemoFlow()
The resulting card will look like this:
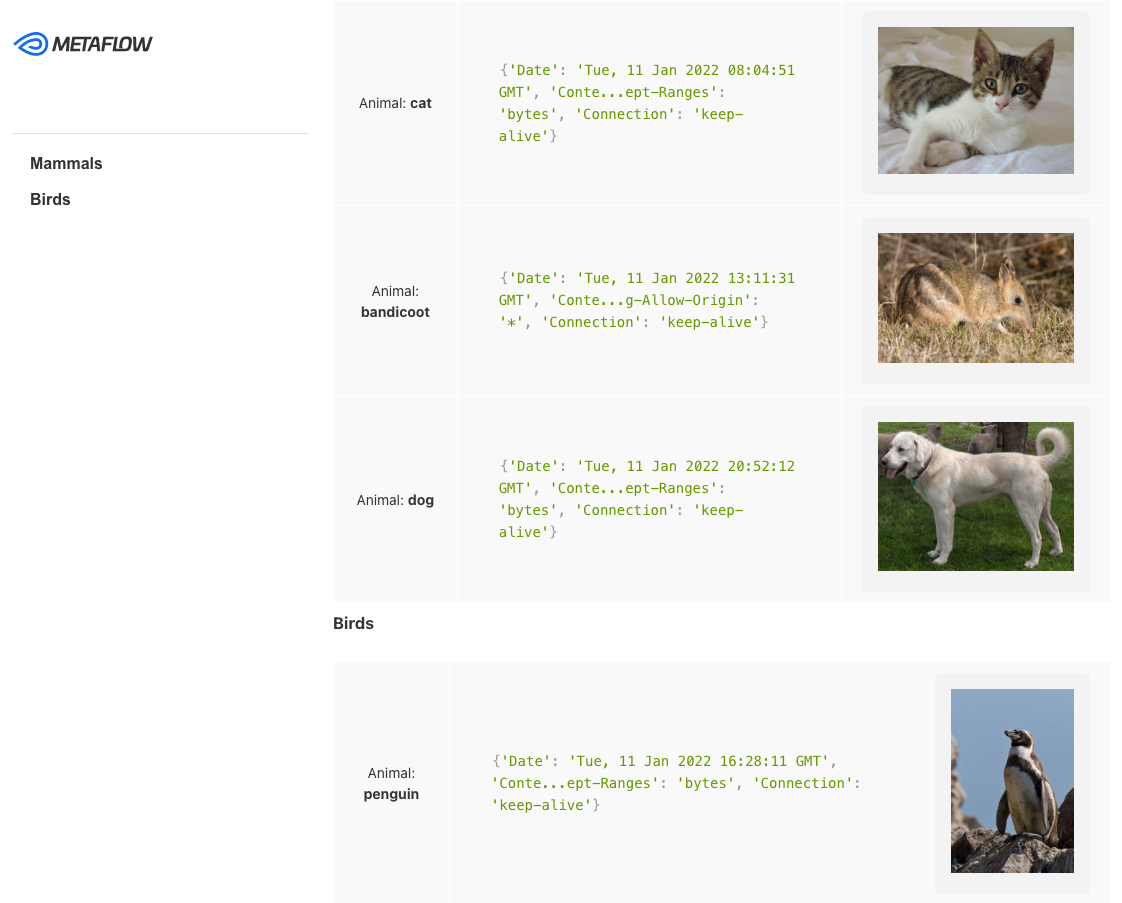
Notice how the Artifact component automatically truncates a large dictionary in the
middle column, so you can use it to safely output even huge objects. It is also worth
knowing that the Image component stores the image in the resulting HTML file itself,
so you can view the card without an internet connection or even if the original image
becomes unavailable.
Showing Plots
As a developer, you may care more about showing data visualizations rather than cat photos. There are two ways to embed visualizations in a card:
You can use
VegaChartto produce a chart on the fly.You can use
Imageto include an image produced by any library.
Let's cover both the approaches.
Charting with VegaChart
VegaChart was introduced in Metaflow 2.11. Make sure you have a recent
enough version of Metaflow to use this feature.
Cards come with built-in support for charts created using the Vega Lite specification. Vega Lite allows you to specify rich visualizations in JSON without having to install any additional libraries.
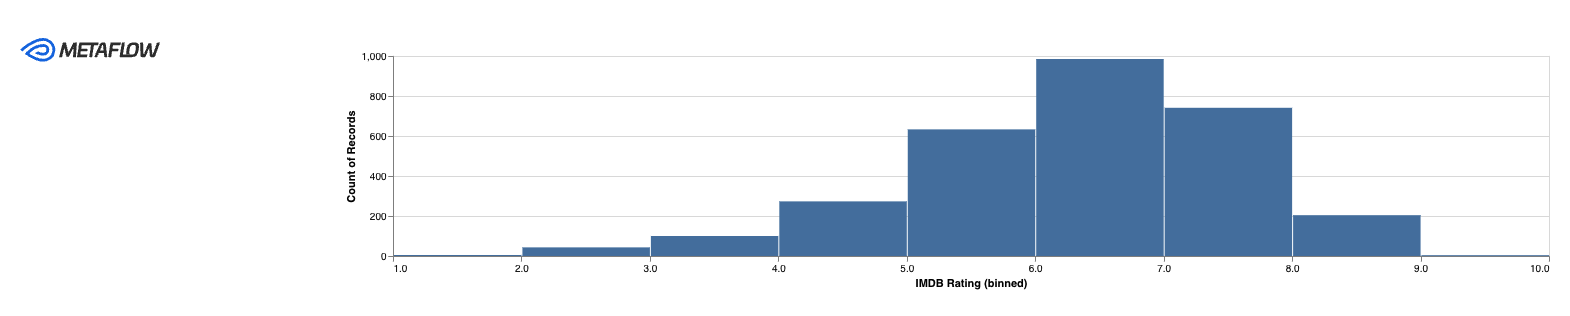
You can navigate to the gallery of Vega Lite
examples and copy-paste any of the
JSON specs in the VegaDemo below (remember to change data URLs as below). For
instance, this example shows a simple
histogram:
from metaflow import FlowSpec, step, current, card
from metaflow.cards import VegaChart

SPEC = {
  "$schema": "https://vega.github.io/schema/vega-lite/v5.json",
  "data": {"url": "https://vega.github.io/vega-lite/examples/data/movies.json"},
  "mark": "bar",
  "encoding": {
    "x": {
      "bin": True,
      "field": "IMDB Rating"
    },
    "y": {"aggregate": "count"}
  }
}

class VegaDemo(FlowSpec):
    @card(type="blank")
    @step
    def start(self):
        current.card.append(VegaChart(SPEC))
        self.next(self.end)

    @step
    def end(self):
        pass

if __name__ == "__main__":
    VegaDemo()
Run the flow to see a histogram like this:
You can find many more examples of VegaChart in the Dynamic
Card gallery.
Using Altair - a Python API for Vega
The Altair library provides a convenient Python API for Vega, so you don't have to navigate the JSON specification by hand. In particular, it makes it easy to visualize data in Pandas dataframes.
Here is a simple example that plots data from a dataframe using Altair. Note
that it uses the @pypi
decorator to make sure
that pandas and altair are available:
from metaflow import FlowSpec, step, current, card, pypi
from metaflow.cards import VegaChart

class AltairDemo(FlowSpec):

    @pypi(packages={"altair": "5.2.0", "pandas": "2.1.4"}, python="3.11.7")
    @card(type="blank")
    @step
    def start(self):
        import pandas as pd
        import altair as alt
        df = pd.DataFrame({'item': ['apple', 'avocado', 'fish'],
                           'cost': [2, 5, 9]})
        chart = alt.Chart(df).mark_bar().encode(
            x='item',
            y='cost'
        )
        current.card.append(VegaChart.from_altair_chart(chart))
        self.next(self.end)

    @step
    def end(self):
        pass

if __name__ == "__main__":
    AltairDemo()
Run the flow to see a bar chart like this:
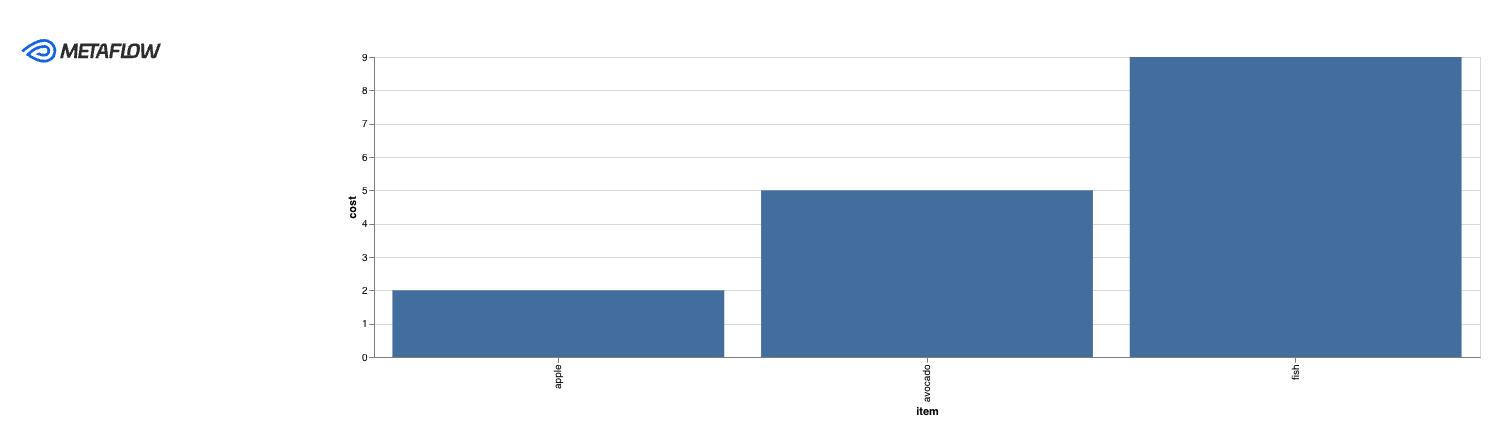
You can find more inspiration and examples in Altair's gallery of examples as well as in our Dynamic Card gallery.
Showing an image with Image
Besides Vega and Altair, you can use any visualization
library in Python to produce plots, save the resulting image in a file or an in-memory
object, and provide the contents of the file (bytes) to the Image component.
For convenience, the Image component provides a utility method,
Image.from_matplotlib, that extracts bytes from a Matplotlib
figure automatically. Here’s an example that uses the @conda
decorator to make sure that Matplotlib is available. If you have
Matplotlib and Numpy already installed in your environment, you can run the example
without @conda_base.
from metaflow import FlowSpec, step, current, card, conda_base
from metaflow.cards import Image

@conda_base(python='3.8.1',
            libraries={'numpy':'1.20.3', 'matplotlib':'3.4.2'})
class MatplotlibFlow(FlowSpec):

    @card(type='blank')
    @step
    def start(self):
        import matplotlib.pyplot as plt
        import numpy
        fig = plt.figure()
        x = numpy.random.normal(0, 0.1, 100000)
        y = numpy.random.normal(0, 0.1, 100000)
        plt.scatter(x, y, s=0.1, color=(0.2, 0.2, 1.0, 0.2))
        current.card.append(Image.from_matplotlib(fig))
        self.next(self.end)

    @step
    def end(self):
        pass

if __name__ == '__main__':
    MatplotlibFlow()
The resulting card will look like this:
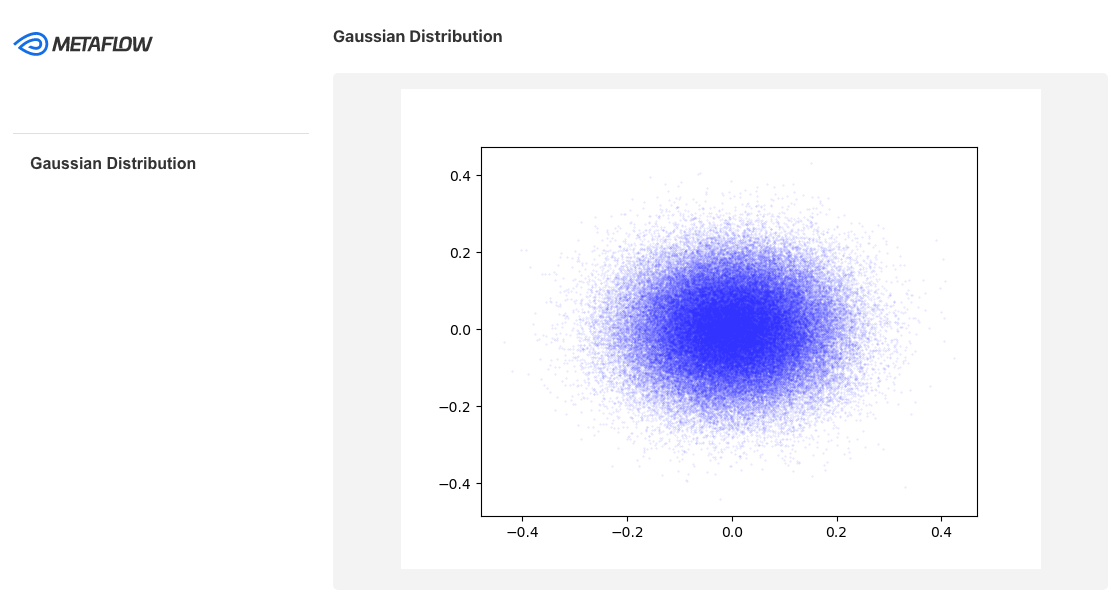
Note that you can click the image in the card to see a larger version of it.
Multiple Cards In a Step
You may want to produce multiple separate cards in a step. Maybe one card shows high-level business metrics that are suitable for wide distribution, while another shows technical details for debugging purposes.
When multiple cards are present, calling current.card.append is ambiguous: As such, it
doesn’t know which of the many cards the component should be added to. Metaflow will
show a warning if you try to do this, but it won’t crash the flow - nothing card-related
should ever cause the flow to crash.
Use the id keyword argument in the @card decorator to uniquely identify each card.
Then, you can refer to a specific card with the current.card[card_id].append notation.
Here’s an example:
from metaflow import FlowSpec, step, current, card
from metaflow.cards import Markdown

class ManyCardsFlow(FlowSpec):

    @card(type='blank', id='first')
    @card(type='blank', id='second')
    @step
    def start(self):
        current.card['first'].append(
            Markdown('# I am the first card'))
        current.card['second'].append(
            Markdown('# I am the second card'))
        self.next(self.end)

    @step
    def end(self):
        pass

if __name__ == '__main__':
    ManyCardsFlow()
When a task has multiple cards, the “card view” command will list all cards that are
viewable for the task. You must specify which exact card you want to view:
- If you have specified an
idfor the card, use the–idoption to view a card corresponding to the givenid. For instance, “card view –id first” to see the card corresponding to@card(id=’first’). - Each card has a unique hash value which is shown by “
card view” and “card list”. You can execute e.g. “card view –hash 23b4e” to see a card corresponding to the given hash.
Comparing Data Across Runs
In many cases, you may want to produce a single card that characterizes the results of
the whole flow. A natural way to do this is to assign a card to the end step that has
access to all results produced by a run.
Besides accessing all results of a single run, you may want to access results across multiple runs and produce a card that compares the latest data to past results. Thanks to the fact that Metaflow persists and versions all results, this can be done easily: Just use the Client API to access past results.
The following example demonstrates how you can create a card that accesses all data
produced by a flow at the end step, as well as compares results across historical
runs.
from metaflow import FlowSpec, step, current, card, conda_base, Flow, Parameter
from metaflow.cards import Image, Table, Artifact
from itertools import islice

@conda_base(python='3.8.1',
            libraries={'numpy':'1.20.3', 'matplotlib':'3.4.2'})
class CompareRunsFlow(FlowSpec):

    alpha = Parameter('alpha', default=0.1)

    @step
    def start(self):
        import numpy as np
        self.x = np.linspace(-1, 2, 100)
        self.y = self.alpha * np.exp(self.x)
        self.next(self.end)

    @card(type='blank')
    @step
    def end(self):
        self.compare_runs()

    def compare_runs(self):
        import matplotlib.pyplot as plt
        rows = []
        fig = plt.figure()
        for run in islice(Flow('CompareRunsFlow'), 3):
            data = run['start'].task.data
            rows.append(list(map(Artifact, (run.id,
                                            run.created_at,
                                            data.alpha))))
            plt.plot(data.x, data.y, label=run.id)
        plt.legend()
        current.card.append(Table(rows,\
            headers=['Run ID', 'Created', 'Alpha']))
        current.card.append(Image.from_matplotlib(fig))

if __name__ == '__main__':
    CompareRunsFlow()
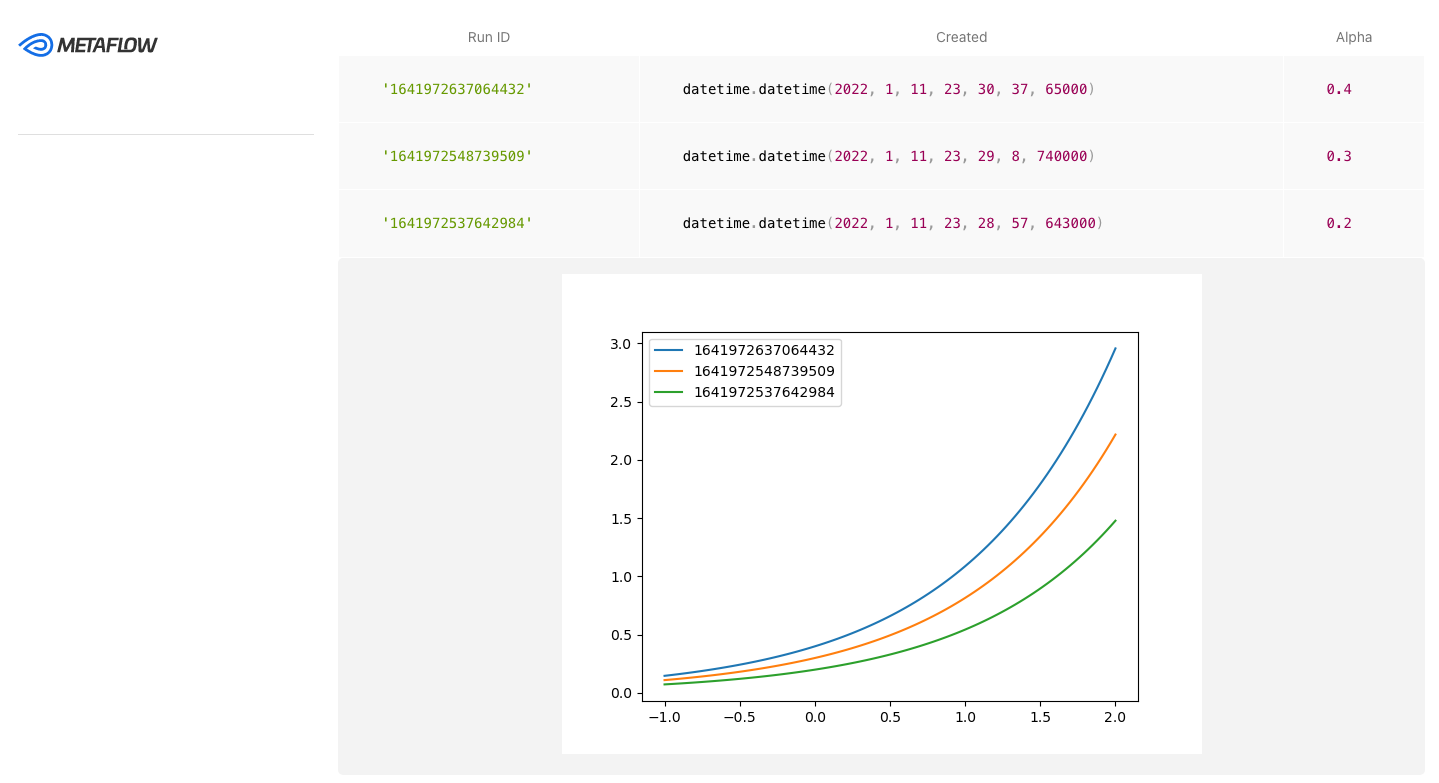
To see the comparison in action, run the flow at least three times with varying values
of the –alpha parameter. Note the following features of the flow:
- The flow-level card is produced by a separate helper function,
compare_runs. It is a good idea to separate code that produces a complex card in its own function or even in a separate module. Thecurrent.card.appendcall is available globally when a task is executing, so there is no need to restrict card creation in a@stepfunction. - The “
islice(Flow('CompareRunsFlow'), 3)” expression is used to access the latest three runs of the flow, including the currently executing one. Thanks to the namespacing functionality of Metaflow, the expression returns the latest three runs executed by you personally, i.e. in your usernamespace, when you run the flow locally. In contrast, if deployed to a production environment, it returns the latest three production runs. This way, you can cleanly manage multiple versions of the project, some in development and some in production, and keep the results separate. - You can use any off-the-shelf libraries, like Matplotlib here, to compare, visualize, and analyze results. You can develop your own helper libraries or Card Templates which standardize the analyses and reporting that are relevant for your projects.
The resulting card will look something like below. It shows the latest three runs of the flow, the parameter supplied for each run, and a visualization that allows you to compare the runs.